OptimizeMaine
Case Studies

Three departments, three systems, all in daily use.

Each one started the same way: a department running real work out of spreadsheets, email, and people’s memory, with no way to see the whole picture.

Each one ended with a single system the department works from. All three were built for Maine HVAC, fabrication, and steel companies, and all three are still in use every day.

Operational counts come from the systems’ records. Time-saved and interruption figures are named employees’ before-and-after estimates, not a controlled time study. Each case below identifies the measurement window or source; customer job numbers and vendors are left out.

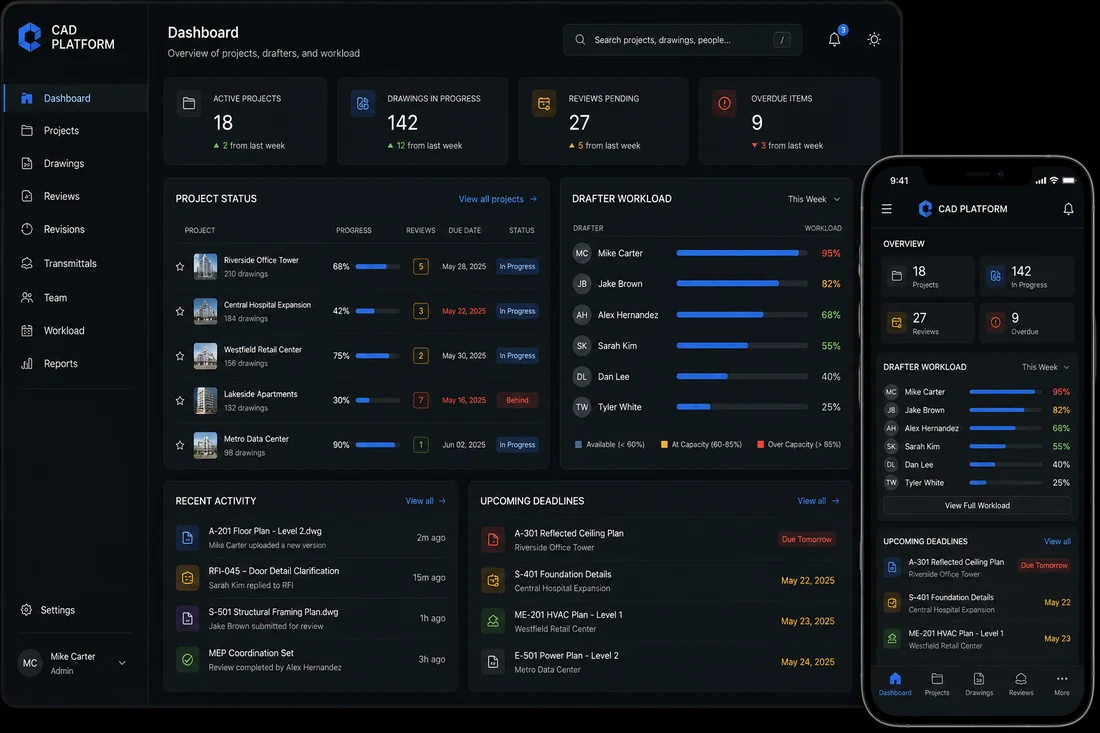
CAD department dashboard on desktop and phone showing active projects, drawings in progress, reviews pending, overdue items, project status, drafter workload, and upcoming deadlines.
Department workload boardAssignments, progress, capacity, and deadlines on one screen
CAD & Drafting9 peopleHVAC & fabrication

A drafting department that could not see its own workload

The problem

Work was handed out by memory and conversation. Some drafters were buried while others had room, and nobody knew until a deadline was already at risk. Answering “where is that job?” meant walking the floor to ask.

What I built

  • A live board of every job and how far along it is
  • Who is buried and who has room, at a glance
  • A manager view for the department, and a personal list for each drafter
  • Every job marked active, done, or blocked, with the drawings linked
  • A full-screen view for a TV on the wall

What changed

  • Managers rebalance work before a deadline slips, not after
  • Anyone can see where a job stands without asking a drafter
  • Status interruptions dropped from about 12 a day to 2
  • The whole department was using it inside a week

Adoption & measurement

All nine department users adopted the live board during its first week. Roland, a BIM drafter at New England Tech Air, estimated that status interruptions fell from about 12 per day before rollout to about 2 per day after the team and managers began checking the board themselves. Treat that figure as a user-reported operational estimate.

12 → 2
Daily status interruptions to a drafter
9
Employees using it, manager to drafter
1 week
To department wide adoption
21
Projects tracked in the system
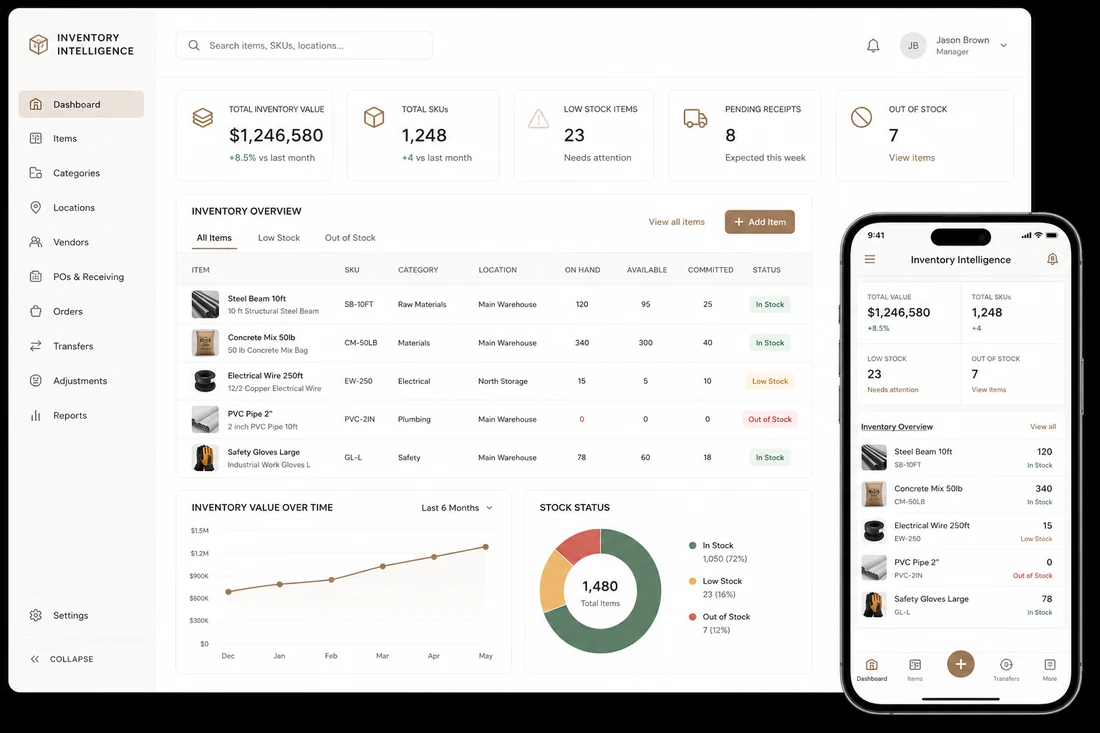
Inventory and purchasing dashboard on desktop and phone showing inventory value, low stock and out of stock counts, item quantities, and value trends.
Inventory and purchasingStock levels, reorder queue, receiving, and usage trends
Shop & Purchasing19 locationsHVAC & fabrication

A shop floor and a purchasing desk that could not see each other

The problem

Stock levels lived on the shelves and in people’s heads. Purchasing heard about a shortage when someone walked over to say so. Nobody could answer what was on order, what was late, or what kept running out.

What I built

  • Every stocked item tracked, by location
  • Orders followed from the moment they go in to the day they arrive
  • Low stock flagged automatically, before anyone runs out
  • Deliveries checked in against the right order, line by line
  • A monthly view of what is on order, what is late, and where the money goes

What changed

  • Receiving a delivery or adjusting a count updates stock as it happens
  • Late orders are a short list to work through, not a surprise
  • Anyone can check stock without walking the floor
  • Purchasing got back 5 to 7 hours a week

Adoption & measurement

Nicole, purchasing agent at New England Tech Air, estimated 5 to 7 hours saved in a typical week after reorders and order-status checks moved into the system. The late-order comparison covers one month; item and location counts come from system records after inventory minimums were established.

5–7 hrs
Purchasing time saved each week
13 → 5
Late orders, over one month
168 → 50
Items out of stock, after minimums were set
360
Items tracked across 19 locations
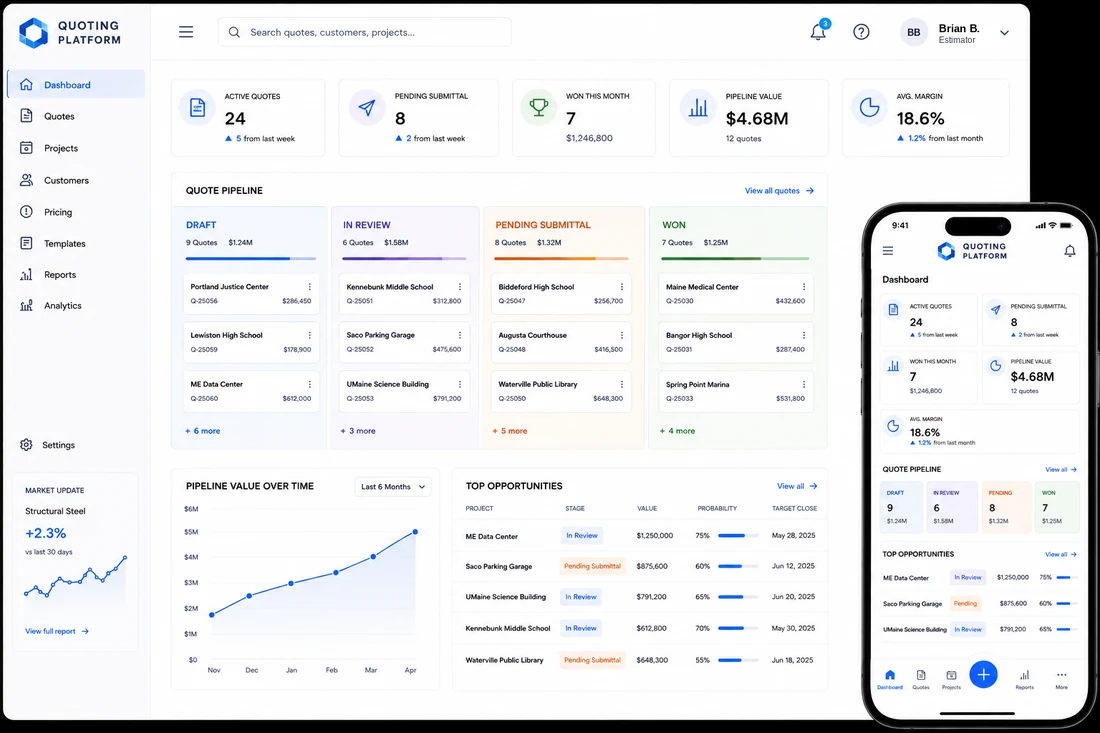
Quoting dashboard on desktop and phone showing active quotes, pending submittals, quotes won, pipeline value, average margin, and a pipeline board from draft through won.
Quote pipelineEvery quote, revision, price, and follow-up in one place
EstimatingEstimating teamSteel & fabrication

An estimating team whose quotes lived in folders and inboxes

The problem

Every quote lived in a folder, an email thread, or someone’s desktop. Finding what was sent, what changed, and which price was used meant digging. Quotes went quiet and nobody noticed until it was too late.

What I built

  • Every quote, customer, and price in one place
  • Quotes built from one shared price list, so numbers match
  • One view of what is drafted, what was sent, and what has gone quiet
  • Full history on every quote, so changes are never in doubt
  • Quotes sent from the system and filed against the job automatically

What changed

  • The team works from one list instead of hunting for the last version
  • Quotes that go quiet get flagged instead of forgotten
  • Management sees what is coming in and going out without asking

Adoption & measurement

Brian, an estimator at Maine Steel, described the practical change: the team works from one shared quote history and receives an automatic follow-up list each morning. The volume figures below are a one-month operational snapshot from the system, not a before-and-after productivity claim.

145
New quotes in a single month
97
Quotes sent that same month
47
Customers served, across 99 projects
1
Shared list the whole team works from

Representative interface based on the delivered system. Client data has been changed.

Your department is the next one. Tell me which workflow is costing your team the most time and you’ll get an honest read on whether software can fix it, and what it would take.

Book a consult now Free · 30 minutes · video or phone